 Quick View
9626 Information Technology: Data processing and information Questions
9626 Information Technology: Data processing and information Questions
Data processing in geography fieldwork
This lesson looks at how to process the data that you have collected in the field. It looks at which process is best and why.
Measures of Central Tendency and Data Processing
AS Geography presentation to explain basic measures and data processing techniques with accompanying ppqs and mark scheme answers.
Making data suitable for processing
A lesson educating students on validation and verification, collecting data and big data
including objectives and keywords.
including exam questions
Suitable for the BTEC TA in DIT Component 2 Learning Aim A
Respirometer - Method, Data Processing and Evaluation
Includes opportunities to discuss experimental design, results and evaluation of limitations
undefined
Data processing in a geography fieldwork enquiry
This lesson looks at how to analyse data from a geography fieldwork that you have collected. It looks at different ways in which you can understand what is being produced.
making data suitable for processing
covers validation and verification with youtube links for pupils to watch to gain a deeper insight to what big data really is
Secondary data for enquiry processes
Secondary data lesson for the New AQA Activate 2 enquiry processes
 Quick View
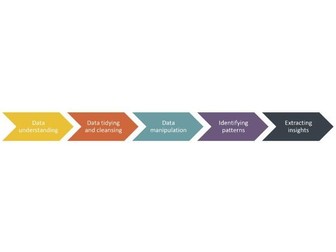
Data Science - The Analysis Process
Free lesson resources for teaching Data Science NPA (National Progress Award) Levels 4,5 and 6.
This lesson covers what is involved in the analysis process, specifically,
• what we mean by analysis
• a structured way of performing analysis (the analysis steps)
• how to understand data through visual inspection
Lesson content,
A PowerPoint/PDF presentation, ‘The analysis process’
Excel Question workbook on ‘The analysis process’ (for learners)
Excel Answers workbook on ‘The analysis process’ (for teachers)
Planning document with learning intentions and success criteria
For more information on the Data Science NPA, please see teachdata.science
This lesson has been created by effini in partnership with Data Education in Schools, The Data Lab and Data Skills for Work, with funding from the Scottish Government.
© 2021. This work is licensed under a CC BY-NC-SA 4.0 license.
 Quick View
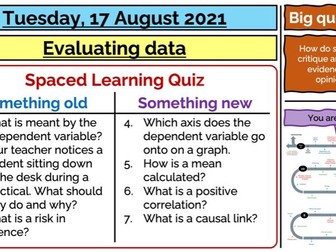
Evaluating data
Sixth lesson in a series of lessons on enquiry processes and safety. This lesson focuses on how to evaluate data.
This lesson uses an A3 sheet that students can use to while they complete the lesson.
Resistivity Experiment - Processing data and Uncertainties
Process Raw data to find Resistivity of Nichrome.
Process absolute error on raw data to find uncertainties
Process gradients by linearizing the equation
Process uncertainty on gradient to give percentage uncertainty on final calculated value of Resistivity of Nichrome.
With answers. AQA Advanced Physics Style of processing uncertainties.
Topic 11 : Measurement and data processing (IB)
Chemistry IB _ Grade 11 and 12
Topic 11 : Measurement and data processing
Paper Airplane Project: Rounding, Estimating and Data Processing
This presentation (including embedded hyperlinks and worksheets) is a multi-week project where students will apply their knowledge of rounding and estimating numbers and then processing that data via various graphing methods. My students had a lot of fun with this and were always eager for the next session. I hope yours feel the same!
Promethean/ActivInspire software is required for this file.
 Quick View
Data Processing Methods - IT Computer Science - A Level
IT Essentials – Computer Processing Types – A Level
Breakdown of Batch, Online and Real processing with pros and cons of each. Comprehension questions. Mix and Match processing features activity. Google quiz for plenary. 3 Revision Flash Cards.
Ideal for IT and Computer Science. Designed for use be expert and non-expert teachers alike.
Wolsey Academy, a non-profit resource provider, directs all profits to various charities, including refugee support, youth sports, educational programs, and carbon capture, achieving a carbon-negative status. Explore our site for resources and free history role-playing games loved by students. Thank you for your dedication to teaching and for supporting our mission.
 Quick View
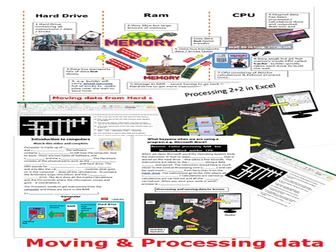
Introduction to Memory RAM and Cache : how data is processed
A range of activities aimed at beginner level :
A Summary of how data from instructions from software on the hard drive is moved via data buses to RAM to cache memory in the CPU. Analogy used in a builder building a wall - how bricks / data moved efficiently 1.Data flow Building Wall.docx
How computers work basic Animation in powerpoint ( summarises the above in animated form - showing users what happens when someone does a simple
calculation in excel. 2.How computers work basic Animation.ppt
A missing word activity summarising the above
3.Processing data Introduction.docx
A crossword in Exel testing key terms studied. 4.Computers Work
Crossword.xls
Answers included
 Quick View
IGCSE - Collecting and Organizing Data
This presentation talks about the sources of data, types of data and the process of collecting data. This presentation also talks about tally tables, frequency tables, stem-and-leaf tables and two-way tables. There’s a lot of examples available!
 Quick View
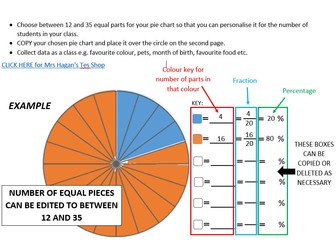
Editable Pie Chart to Process Class Data
This editable document allows you to create a pie chart of between twelve and thirty five pieces. You can personalise data collected from your class no matter how many students you have.
Collect data such as favourite colours, pets, favourite foods, month of birth etc. from your students and then they can display their findings in this pie chart.
There is a colour key, fractions and percentages, all of which can be copied or deleted as necessary.
 Quick View
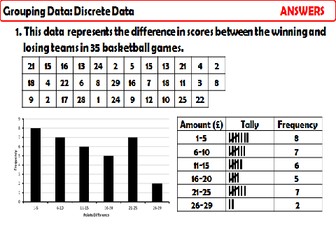
Grouping Discrete Data
A complete lesson on ‘Grouping Discrete Data’, written for the new GCSE specification. Starter looks at whether data should be counted or measured and reinforces the differences between discrete and continuous data. Rationale for grouping examined. Examples of data being grouped, tallied and then represented. Questions and answers on slides.
Bundle
 Quick View
Representing Data
Powerpoint with worksheets for Tally Chart, Bar Chart, Pictograms( on PP) Venn diagrams, Carroll Diagrams, Pie charts and Line Graphs
How Computers process information.
Data Bus
Processing
Address Bus
Control Bus
This is a powerpoint explaining how the processing works inside a compter at the very basic level. Used to inform students who are starting a computer science course.
The powerpoint builds up showing the routes data,comms and address information takes.