
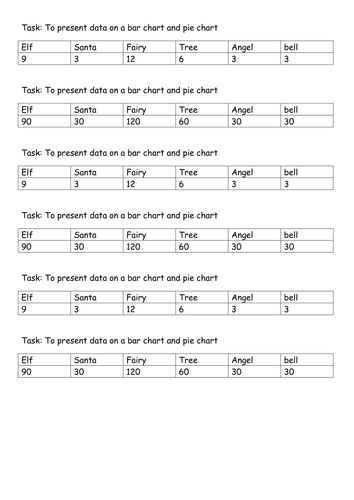
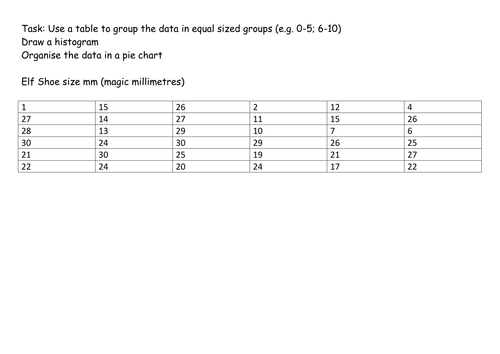
The children have a range of data which they need to group in regular intervals.
This can then be made into a histogram.
As their are 36 pieces of data, this histogram can them be put into fraction form, where the fractions are reduced into their simplest term before the data can be presented as a pie chart. There is another resource on here that I have made which is a blank pie chart split in to 12 equal parts which would compliment this activity as the fractions reduced into twelve (or thirds, quarters and sixths)
Enjoy and comment if you enjoy them
Something went wrong, please try again later.
This resource hasn't been reviewed yet
To ensure quality for our reviews, only customers who have downloaded this resource can review it
Report this resourceto let us know if it violates our terms and conditions.
Our customer service team will review your report and will be in touch.
£0.00