

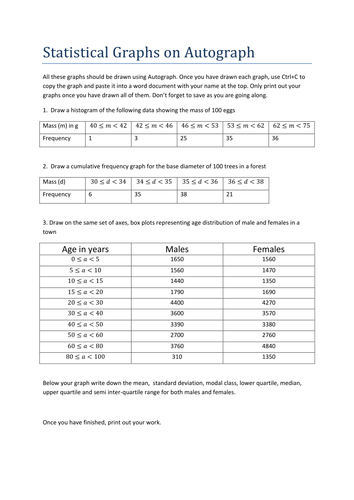
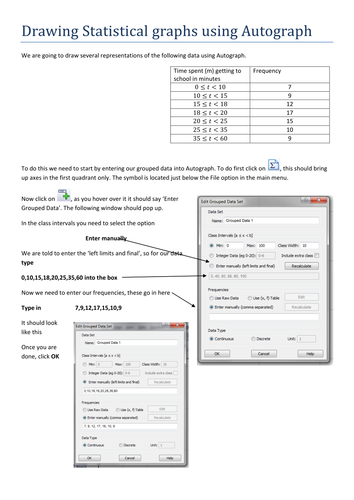

First give out the tutorial sheet which guides students through drawing a histogram, cumulative frequency graph and box plots using Autograph when the data has unequal class intervals.
Then give out the worksheet and let them have a go at doing it themselves.
Good practise for those students studying GCSE Stats before they get going on their controlled assessment but equally appropriate for Higher GCSE (just ignore the bit about standard deviation).
Something went wrong, please try again later.
A great step-by-step guide/activity for students (and teachers) to use Autograph to create statistical diagrams. Brilliant - thank you
Report this resourceto let us know if it violates our terms and conditions.
Our customer service team will review your report and will be in touch.
£0.00