
Handling data (three days).
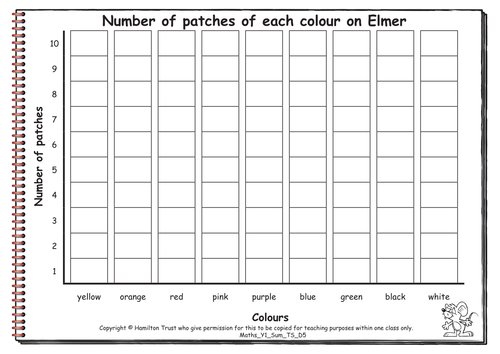
Children draw pictograms to show the months of their own and teachers’ birthdays. They count the number of each colour on Elmer and produce a block graph to show the results. Following reading Eat Your Peas they produce pictograms of the vegetable they don’t like and like, and the numbers of peas in pods.
Find additional lesson plans and resources at www.hamilton-trust.org.uk.
Something went wrong, please try again later.
a great lesson plan for year 1 using a pictogram with all the resources to use with it.
Report this resourceto let us know if it violates our terms and conditions.
Our customer service team will review your report and will be in touch.
£0.00