
Handling data (three days).
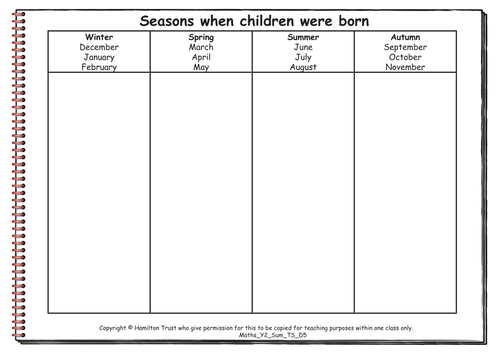
Children find out which season of the year has more birthdays and show this information in a block graph; they vote for their favourite school day and display this information in a pictogram. They count how many of a given action (including writing months of the year) they can do in 30 seconds and record the results in block graphs and pictograms.
Find additional lesson plans and resources at www.hamilton-trust.org.uk.
Something went wrong, please try again later.
Super data handling planing for Year 2, based on days, month and seasons. Uses block graphs and pictograms.
Report this resourceto let us know if it violates our terms and conditions.
Our customer service team will review your report and will be in touch.
£0.00