
Handling data: frequency tables, bar charts, pie charts and line graphs (four days).
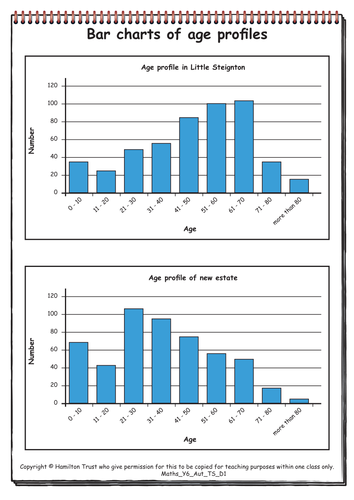
Grouped data is used in frequency tables and bar charts. Children draw line graphs and read intermediate points. They match stories to line graphs and write their own stories to accompany line graphs. Children learn how to construct, interpret and compare simple pie charts.
Find additional lesson plans and resources at www.hamilton-trust.org.uk.
Something went wrong, please try again later.
Excellent detailed lesson plans, a good range of group and individual activities. These plans and activities are easily adaptable to own class needs.
Report this resourceto let us know if it violates our terms and conditions.
Our customer service team will review your report and will be in touch.
£0.00