
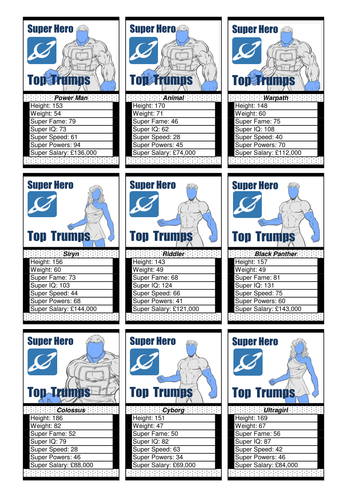

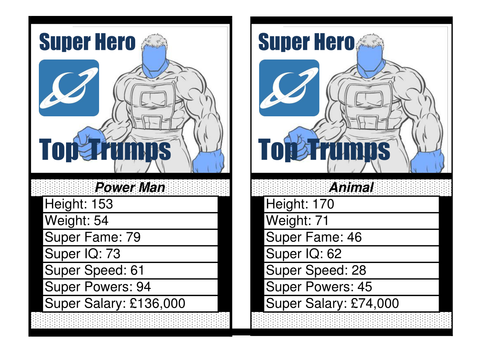

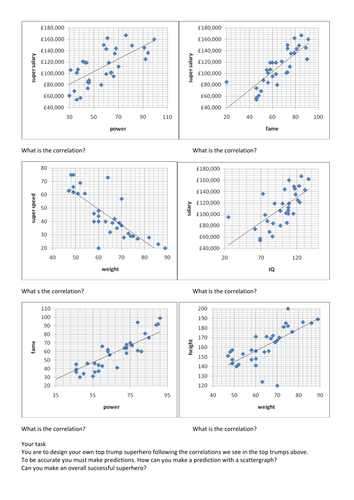
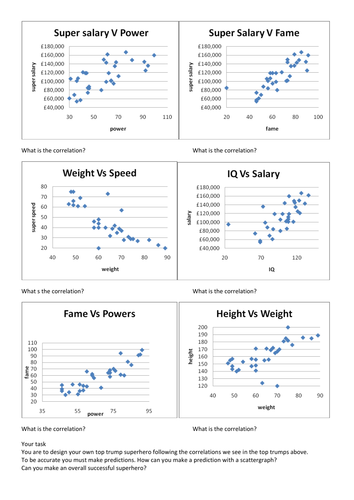
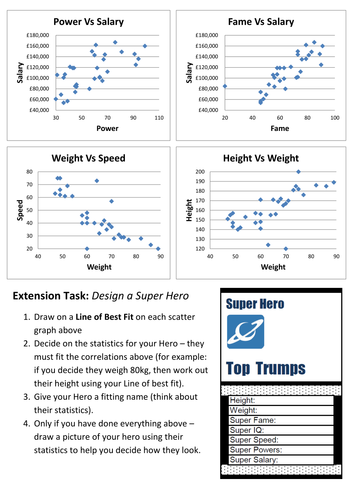

lttmaths.com Top Trump cards depicting superheroes - their statistics correlate (e.g: height / weight or fame / salary etc.) and can be used to plot scatter graphs. I have used these by giving each pupil a hero card, then done a human scatter graph. They then created their own hero card (making sure their statistics fit the correlations shown on the graph sheets).
They could also be used for calculating averages, sampling techniques..... and playing top trumps!
N.B - original spreadsheet from another TES user.
Something went wrong, please try again later.
Interesting, looks great for mainstream, but not really useful for my students with SLD.
This is a great resource. Thank you for sharing it. It is really enjoyable for the students to use and a novel way of looking at scatter graphs for them. :)
Thanks very much for sharing this. It is an impressive resource. I'm going to use it.
Really enjoyed this resource and students liked forming theories about what variable indicated success for a superhero. <br /> My kids also designed their own trump card with the idea that it would be a valuable card without being ridiculous - in that it wouldn't trump every category.
Report this resourceto let us know if it violates our terms and conditions.
Our customer service team will review your report and will be in touch.
£0.00