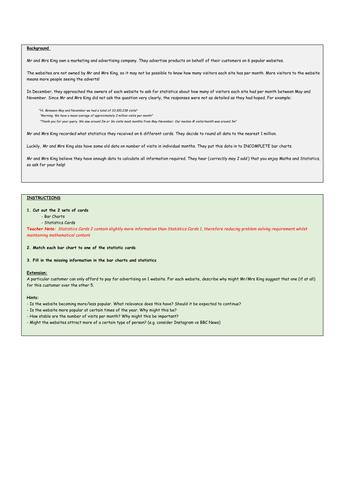

This is a matching cards activity. The topic covered is bar charts, and aims to progress learning from how to draw bar charts to using them to find descriptive statistics such as mean, median, mode and range.
Recommend using PDF version.
Excel version attached to enable teachers to make their own changes if necessary.
Recommend using PDF version.
Excel version attached to enable teachers to make their own changes if necessary.
Something went wrong, please try again later.
This is an excellent resource to encourage reasoning and deepen students' understanding of averages. I used it with a mixed ability Year 7 group and every student could access the activity.
Report this resourceto let us know if it violates our terms and conditions.
Our customer service team will review your report and will be in touch.
£0.00
