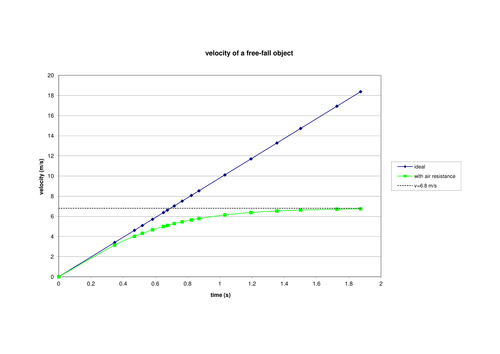


Experimental and modelled data of a falling shuttlecock to demonstrate terminal velocity. One graph shows the actual velocity-time graph compared with the ideal (no air resistance) and the other shows the distance-time graph from the experimental data.
Something went wrong, please try again later.
Lovely spreadsheet - thanks!
Report this resourceto let us know if it violates our terms and conditions.
Our customer service team will review your report and will be in touch.
£0.00