pptx, 342.21 KB
pptx, 342.21 KB
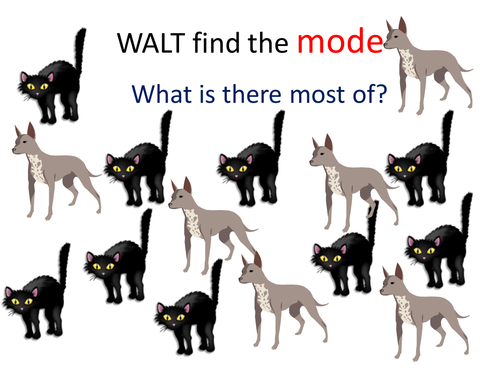
A set of ppt slides with pictures and the students look for which there is most of eg. dogs or cats. Created to enable very low ability KS3 students to understand this average.
Creative Commons "Sharealike"

Reviews

5

Something went wrong, please try again later.

Blatchfordr

9 years ago
5

Great Thank you - allows us to start with something fun!

msejp

9 years ago
5

Thank you

cbannist

10 years ago
5

Great - very colourful with lots of practice

jmossy

10 years ago
5

nice thanks will use this often with my group

harpie

10 years ago
5

Nice, thank you!

Report this resourceto let us know if it violates our terms and conditions.
Our customer service team will review your report and will be in touch.