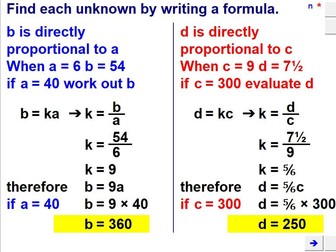
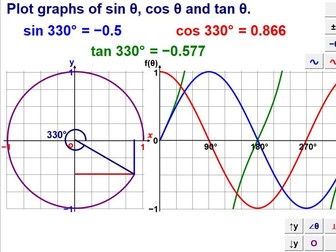
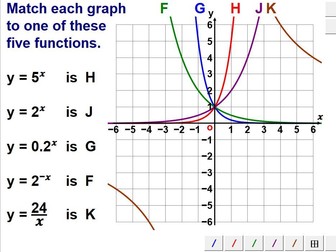
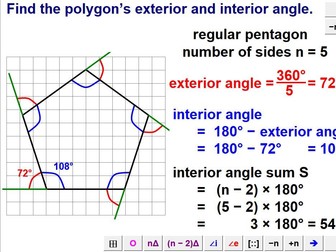
 Quick View
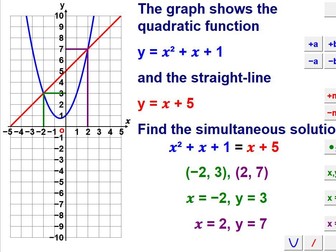
Solve Simultaneous Equations Algebraically
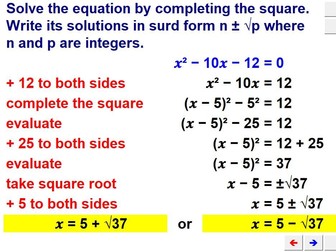
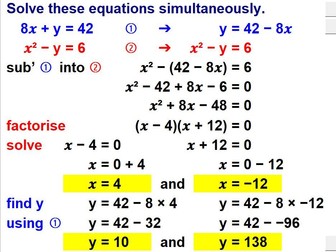
Interactive macro-enabled MS-Excel spreadsheet. Contents: Solve two linear equations, add or subtract (+ve x & y). Solve two linear equations, add or subtract (±ve x & y). Solve two linear equations, add or subtract (fractional x & y). Solve two linear equations, multiply one (+ve x & y). Solve two linear equations, multiply one (±ve x & y). Solve two linear equations, multiply one (fractional x & y). Solve two linear equations, multiply both (+ve x & y). Solve two linear equations, multiply both (±ve x & y). Solve two linear equations, multiply both (fractional x & y). Solve linear & quadratic equations simultaneously (±ve x & y). Solve linear & quadratic equations simultaneously (fractional x & y). Solve linear & quadratic equations simultaneously (decimal x & y).