
Measures and handling data: range, mode, mean and median (five days).
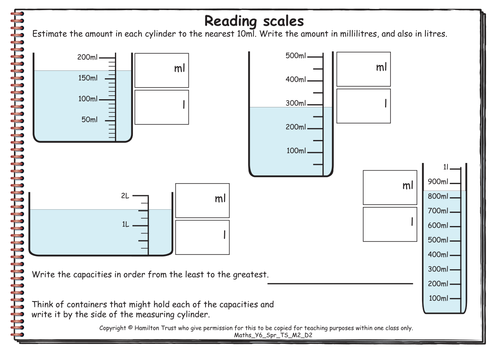
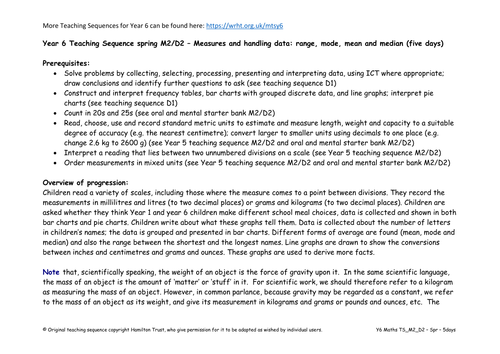
Children read a variety of scales, including those where the measure comes to a point between divisions. They record the measurements in millilitres and litres (to two decimal places) or grams and kilograms (to two decimal places). Children are asked whether they think Year 1 and year 6 children make different school meal choices, data is collected and shown in both bar charts and pie charts. Children write about what these graphs tell them. Data is collected about the number of letters in children’s names; the data is grouped and presented in bar charts. Different forms of average are found (mean, mode and median) and also the range between the shortest and the longest names. Line graphs are drawn to show the conversions between inches and centimetres and grams and ounces. These graphs are used to derive more facts.
Find additional lesson plans and resources at www.hamilton-trust.org.uk.
Something went wrong, please try again later.
Thank you for sharing your resource. This resource has been recommended for teachers by the TES Resource Team and will feature in the Primary newsletter.
Great for lower level year 7s. Thanks!
great revision exercise thanks
Detailed lesson plans, excellent practical activities and worksheets. This planning can be easily adapted to suit own class needs.
Report this resourceto let us know if it violates our terms and conditions.
Our customer service team will review your report and will be in touch.
£0.00