

This is the 'closing lesson' for a module we do on Mathematical modelling, designed for year 9 students.
Students use estimation to work out how much time Santa would have per household on Christmas eve (making some fairly sweeping assumptions....!)
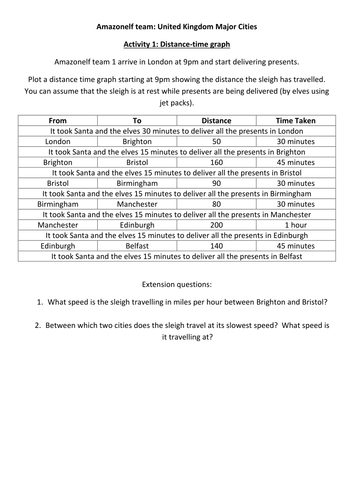
They then draw distance-time graphs, conversion graphs and linear/quadratic graphs (depending on level they are working at). Axes are included for distance-time and quadratic graph.
You may not wish to use the whole thing, but could pick out bits and pieces.
Something went wrong, please try again later.
Report this resourceto let us know if it violates our terms and conditions.
Our customer service team will review your report and will be in touch.
£0.00