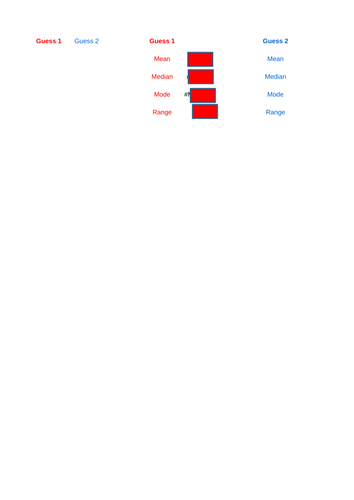

This is a video to accompany my article for the TES Magazine ('Dotty Thinking') that offers up a simple, fun idea to get students engaged and making meaningful data comparisons, including mean, median, mode, range and a whole host of statistical diagrams including cumulative frequency, histograms and bar charts. Click the links below to see the article and download the resources (Video tutorial, PowerPoint and Excel). Ideal for KS3 and GCSE students.
Something went wrong, please try again later.
thank you
Thank you for publishing your resource. It has been selected to be featured in <a href="https://www.tes.com/teaching-resources/collections/secondary-maths/"> a new secondary maths collection</a>.
Great teaching idea. It can lead into a lot of analysis
The best resource I have ever used to bring Averages to life. Students loved it, talked about it and more importantly understood the averages. Thanks for sharing.
Report this resourceto let us know if it violates our terms and conditions.
Our customer service team will review your report and will be in touch.
£0.00