
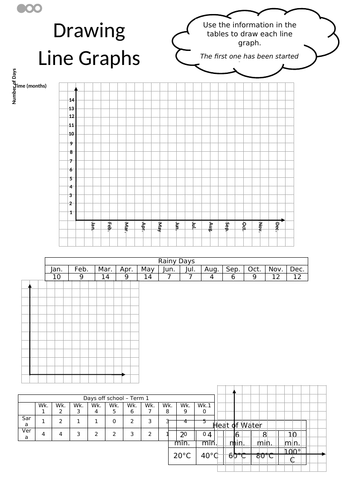
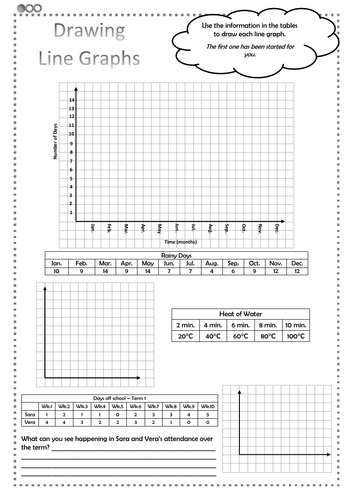
This set of worksheets is intended for practice in drawing line graphs based on data given in tables. They follow on from lesson 4 in a lesson sequence available on TES. Some interpretation questions are also included.
Differentiated:
3 dots = higher ability, 2 dots = middle ability, 1 dot = lower ability
Download the 4 lesson sequence these worksheets correspond with via the link:
https://www.tes.com/teaching-resource/data-4-lesson-smart-notebook-slides-tables-two-way-tables-line-graphs-ks2-11995417?theme=4
For other worksheets from this series, follow these links:
Simple Tables - https://www.tes.com/teaching-resource/simple-data-table-differentiated-worksheets-ks2-statistics-11995451
Two-way Tables - https://www.tes.com/teaching-resource/two-way-tables-differentiated-worksheets-data-statistics-ks2-11995458
Interpreting Line Graphs - https://www.tes.com/teaching-resource/interpreting-line-graphs-differentiated-worksheets-ks2-11995467
Get this resource as part of a bundle and save up to 33%
A bundle is a package of resources grouped together to teach a particular topic, or a series of lessons, in one place.
Something went wrong, please try again later.
This resource hasn't been reviewed yet
To ensure quality for our reviews, only customers who have purchased this resource can review it
Report this resourceto let us know if it violates our terms and conditions.
Our customer service team will review your report and will be in touch.
£1.50