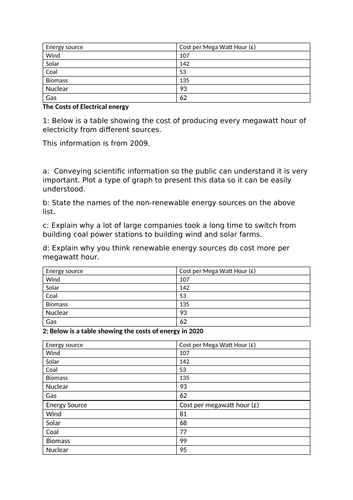

A very general worksheet asking students to consider the energy transition. Two simple tables that show how the different sources of electrical energy have changed in the last decade. Students have the opportunity to plot a graph and compare different energy sources. Then analyse how and why the price has changed, especially the price of renewable energies.
This worksheet comes with answers.
Something went wrong, please try again later.
This resource hasn't been reviewed yet
To ensure quality for our reviews, only customers who have purchased this resource can review it
Report this resourceto let us know if it violates our terms and conditions.
Our customer service team will review your report and will be in touch.
£1.00