

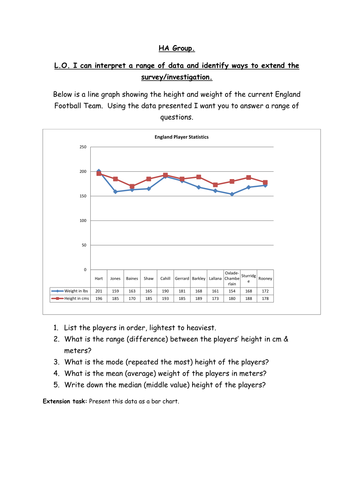
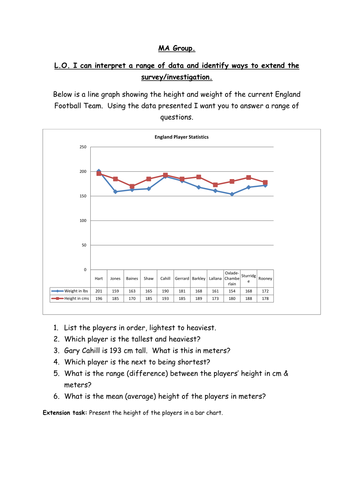
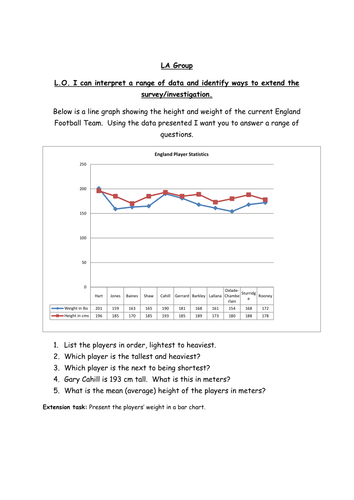

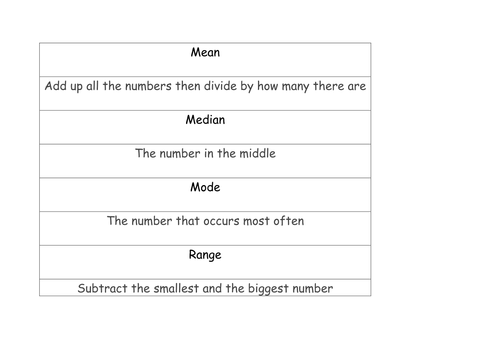
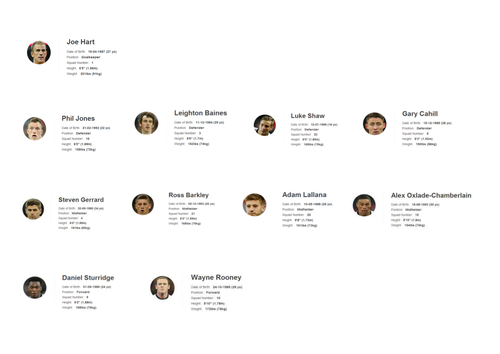
A Data Handling lesson I have planned for an observation. Children will learn to investigate a range of data and answer differentiated questions to work out the mean, median, mode and range (calculators can be used for mean questions). The starter activity is simply ordering players by height. There are also some questions focused on converting measures. extension activity is to create a bar chart from the data. Any constructive criticism or positive feedback would be greatly appreciated.
Something went wrong, please try again later.
Fantastic! Recommended and I'm using it in an assignment I'm writing!
Excellent. My boys will love this!
This was great,a fab resource, thank you.
Think you should be using bar charts for this kind of comparison data... Line graphs for tracking changes over a period of time eg temperature, growth rate of one person/thing, pound against the dollar etc
Great. Thank you :)
Report this resourceto let us know if it violates our terms and conditions.
Our customer service team will review your report and will be in touch.
£0.00