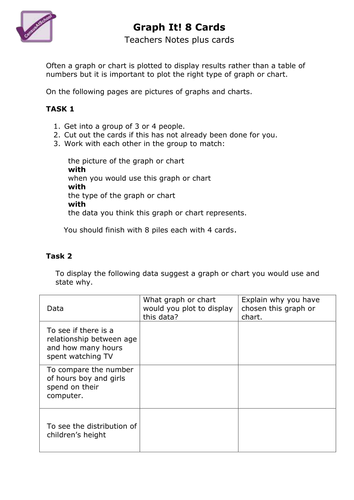
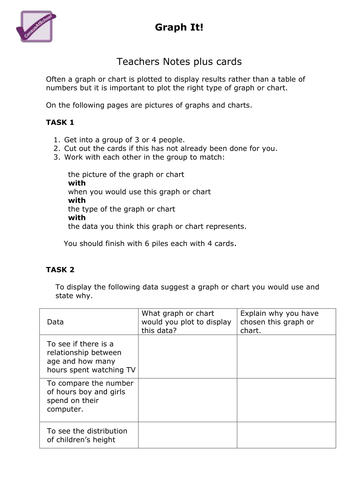
Often a graph or chart is plotted to display results rather than a table of numbers but it is important to plot the right graph or chart. This card matching activity asks the learner to match a picture of the graph/chart to it's name, the type of data it could display and when to use it. (Bar charts, pie charts, histograms, scatter diagrams, line graphs (time series) and box plots for KS3, KS4 and KS5.)
Tes classic free licence
Reviews
4.5
Select overall rating
(no rating)
Your rating is required to reflect your happiness.