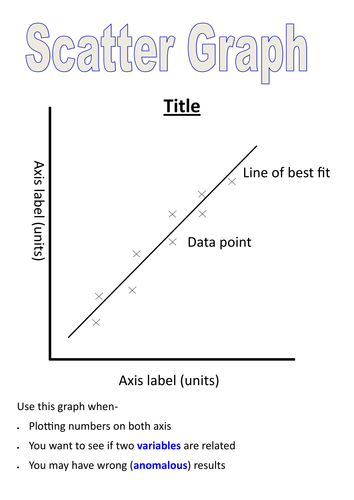

A3 posters providing information about what should be included on different types of graphs and when to use the graphs.
Please review, thankyou :)
Something went wrong, please try again later.
Thank you, very nicely laid out but it doesn't explain the difference between line and scatter graphs. This is something people often struggle with - a scatter graph is used when there are two dependent variables and you are looking for a correlation. A line graph shows the relationship between an independent and a dependent variable. I'm also not sure whether anomalies make a difference.
Report this resourceto let us know if it violates our terms and conditions.
Our customer service team will review your report and will be in touch.
£0.00