
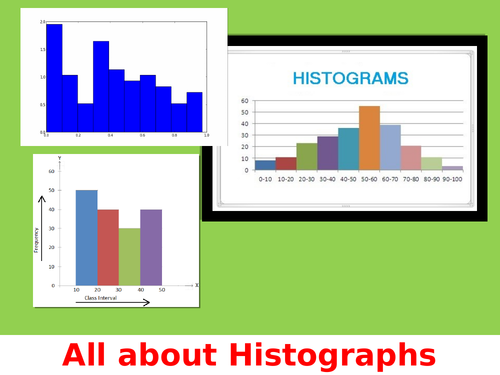
This power point presentation is an introductory lesson in histograms. British teachers would see this as a lesson in frequency graphs while Canadian teachers would see this as a lesson on histographs. Please note that in Canada we tend to call it histographs more often than histograms, which is more common in the British curriculum. The lesson includes an in class activity, to be done together and then a homework activity for the students to do. The lesson tries to help the students see how histograms are relevant to them, by relating to the pandemic of 2020 - 2021.
This lesson does not include frequency density while is needed in the higher levels of GCSE and A levels.
Something went wrong, please try again later.
This resource hasn't been reviewed yet
To ensure quality for our reviews, only customers who have purchased this resource can review it
Report this resourceto let us know if it violates our terms and conditions.
Our customer service team will review your report and will be in touch.
$3.00