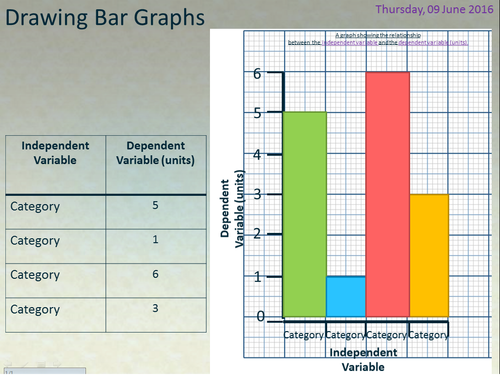

A step by step guide (animation) on how to draw a science bar GCSE spec graph.
Suitable for Year9-Y11 (AQA + OCR = GCSE).
Age: 13-16 (Suitable for other ages with minor changes).
100 powerpoint animations timed together to represent the different stages of drawing a graph.
There is an hours work on one slide! This is perfect for those who find it hard to create animations!
This will save you lots of time and the pupils will respond well!
I have been observed using this slide multiple times and I have always been asked to share it after!
I would recommend following this up with three differentiated graph tasks.
This resource is a 1 slide animation that can be easily copied into your own powerpoint or used as a stand alone file.
Animation, presentation, plotting bars, axis, labels, units, table, title, plotting, scaling, graph paper, dependent, independent & variables.
Verbal steps to follow animation:
Find the largest data values for the dependent and independent variables.
Check the number of squares along the X and Y axis on the graph paper.
Draw a line on the X and Y axis.
Add a scale for the X and Y axis.
Label the independent variable (with units) on the X axis and
the dependent variable (with units) on the Y axis.
Plot the data from the table onto the graph.
Give the graph a title.
Something went wrong, please try again later.
This resource hasn't been reviewed yet
To ensure quality for our reviews, only customers who have purchased this resource can review it
Report this resourceto let us know if it violates our terms and conditions.
Our customer service team will review your report and will be in touch.
£2.00
