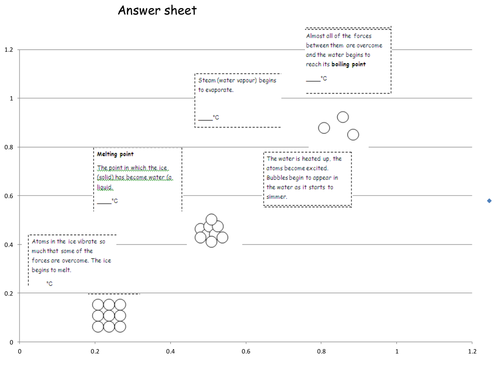


Students use their results from a previous experiment of melting an ice cube to plot an annotated line graph.
Documents are pitched towards a first term Year 7 class. Scaffolded work can be removed and higher differentiated sheet can be used for higher ability KS3 classes who can already plot line graphs independently.
Students consolidate their understanding of melting points by applying it to unusual examples such as gallium metal.
Something went wrong, please try again later.
Fantastic resource.
Report this resourceto let us know if it violates our terms and conditions.
Our customer service team will review your report and will be in touch.
£4.00