
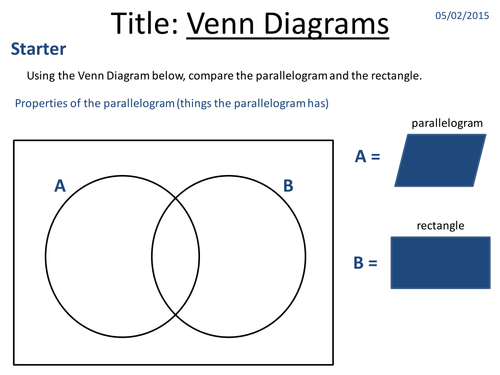
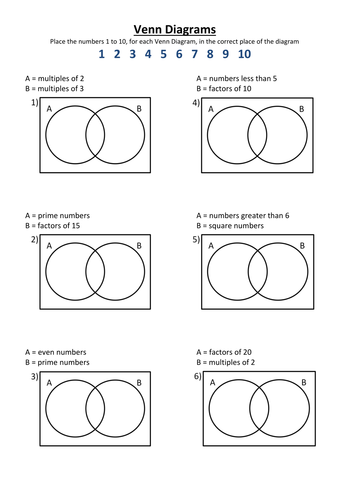
A complete lesson PowerPoint to introduce Venn Diagrams and get students interpreting/using them to find probabilities. A worksheet is provided for students to work on. All examples are fully explained and animations on the ppt used effectively to do so. All answers included and all teacher notes are given in the ‘notes’ section of each slide. Also includes a 10 question plenary using my ABCD fans, but mini whiteboards could be used instead.
Something went wrong, please try again later.
This resource hasn't been reviewed yet
To ensure quality for our reviews, only customers who have purchased this resource can review it
Report this resourceto let us know if it violates our terms and conditions.
Our customer service team will review your report and will be in touch.
£4.00