
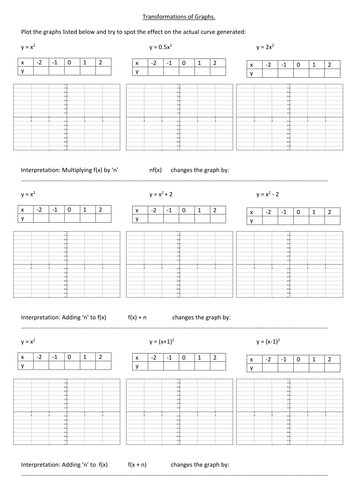
This is a first look at the effect of transforming quadratic graphs. For each row of three graphs they first draw f(x) = x^2 then look at the implications of things such as nf(x) or f(x + n). This is designed to be an investigation which they can do to start with and then discus the results at the end to try and describe the trends they have noticed. I would follow this up with something more concrete in the next lesson or section of a lesson.
Something went wrong, please try again later.
A nice investigative way to explore transformations of quadratics.
Report this resourceto let us know if it violates our terms and conditions.
Our customer service team will review your report and will be in touch.
£0.00