
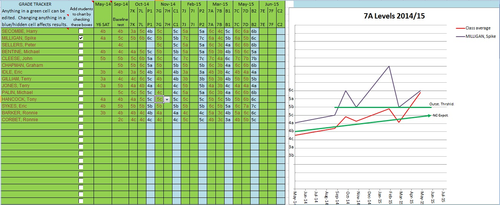

Excel (Office 2007 - macro enabled) workbook that provides a visual track of pupil progress. This is designed for a Year 7 Science class of 25 students. Once baseline data is entered (either Y6 SAT or Sept. baseline test results or both) then a class average is plotted (red) together with a 3 sub level increase target for the class (Outstanding). NC expectations are also shown.
Individual students can be added or removed from the graphic at will.
As it is based on NC Y7 Science, which I teach two units at a time, data points that are plotted are an average of two levelled tasks every six weeks or so. Could easily be adapted for any KS3 subject.
The workbook is protected but students and their levels can be changed as well as the dates of the assessed tasks. Everything else is automatic.
Thanks for the feedback. I have updated things for the 2015/16 academic year. I'll post an unprotected version of this later for those that want to adapt and change things further.
I have worked on adding more classes for Years 8 and 9 so that it is a complete KS3 solution for a four form entry school. This version can be found here https://www.tes.com/teaching-resource/key-stage-3-level-tracker-unprotected-version-year-7-9-4-classes-per-year-11120431
More suggestions welcome.
Something went wrong, please try again later.
Great
Again can I echo the previous comments. A really good resource but struggling to alter the date to the current term 2015/16 on the graph due to the restrictions. If you could provide a workaround that would be awesome.
It is a great idea but currently too many of the cells are protected or hidden which makes it difficult to alter the spread sheet to suit individual teacher/school requirements.
Love the resource and think it will work really ell in our school. The only issue I am having is when I change the dates to the forthcoming academic year (15-16) it is not altering the graph's x-axis? If you could help then it will be perfect!
Report this resourceto let us know if it violates our terms and conditions.
Our customer service team will review your report and will be in touch.
£0.00