
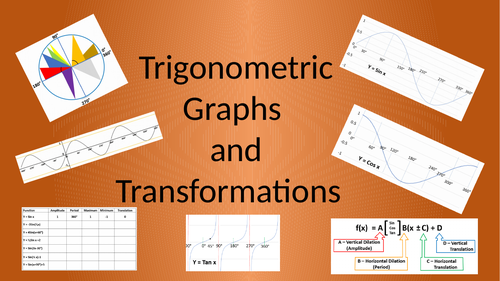
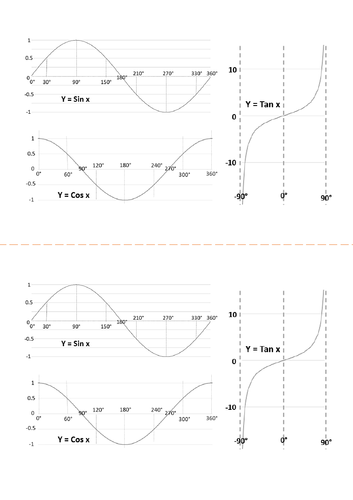
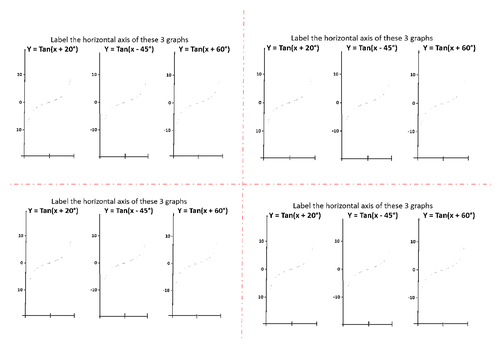
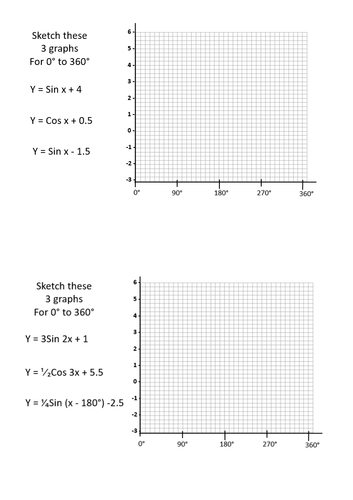
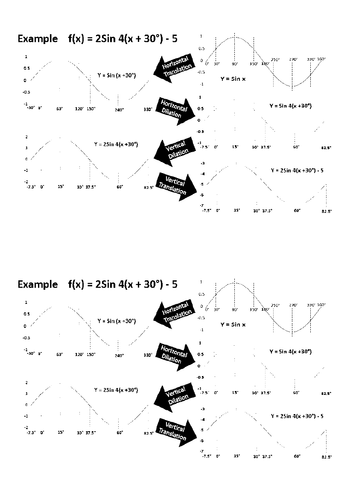
The main part of this PowerPoint is 30 slides, it begins with the calculation and shape of the three Trig graphs, then introduces the four ways in which the graphs can be transformed f(x) = A sin B(x+C)+D. Each of the transformations are considered individually with examples, then each has three “state the function” questions for students to answer verbally (slides 14, 18 ,23, 27). Next, an example of a function with all four transformations is worked with steps in appropriate order. The main part of the slide show concludes with another statement of the “four-transformation form of equation”, and an example of the four resultant transformations are shown step by step.
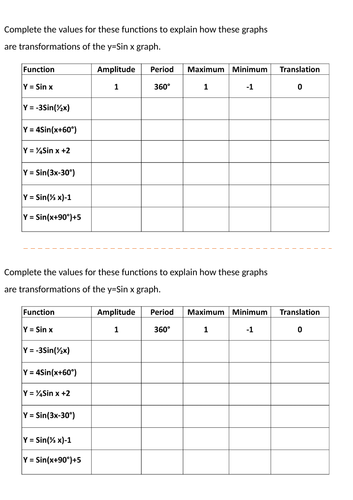
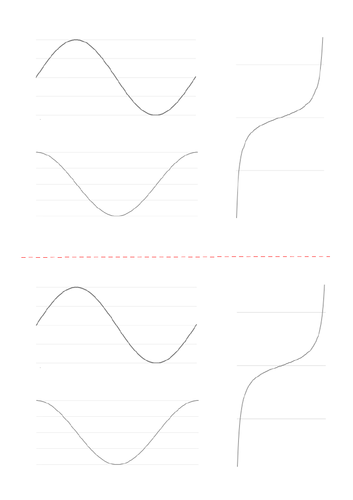
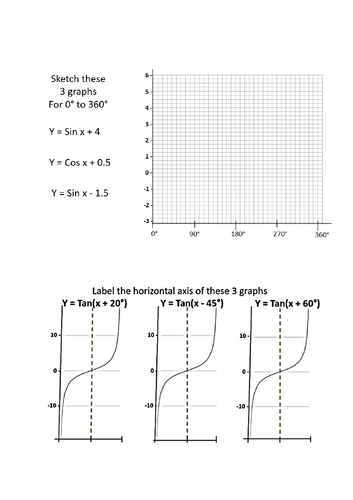
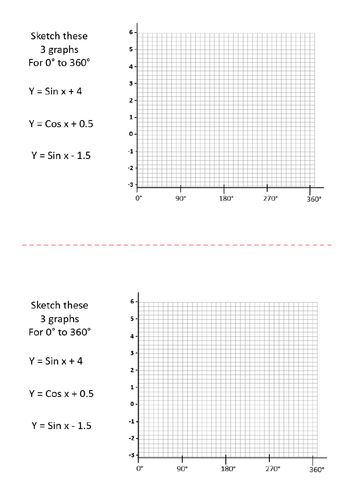
Slides 32 -34 are graph drawing worksheets with answers appearing, for which masters are included as word documents since you may wish to use these for students practice work. Slide 35 is a table to complete with values for the given formulas each with 2 transformations, and slide 36 shows the 3 standard Excel drawn graphs.
Something went wrong, please try again later.
This resource hasn't been reviewed yet
To ensure quality for our reviews, only customers who have purchased this resource can review it
Report this resourceto let us know if it violates our terms and conditions.
Our customer service team will review your report and will be in touch.
£3.00