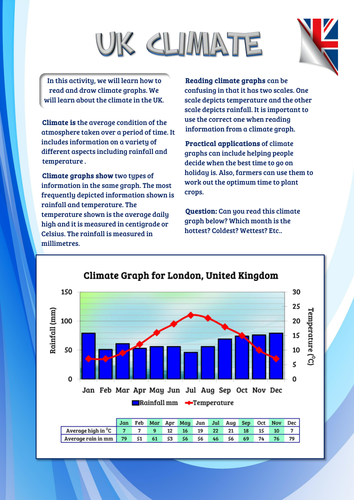
This activity teaches the pupils first to read a climate graph and then to make one. It concentrates on climate data for the UK and for an extension activity, the pupils have to compare the climates of London and Edinburgh.
Tes classic free licence
Reviews
4.4
Select overall rating
(no rating)
Your rating is required to reflect your happiness.