

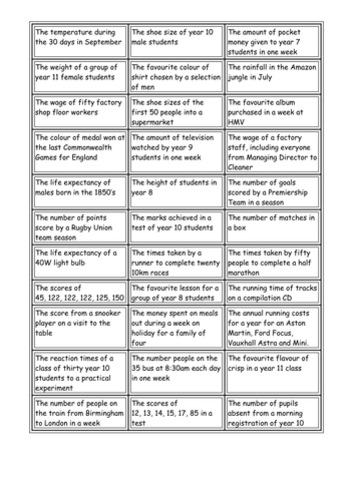
Activity for students to discuss which average is most appropriate for the information they are given on a card. I have taught this using a Venn Diagram with over lapping regions so the students can decide if they think two or all three averages are good to use for the given information.
Something went wrong, please try again later.
Thank you for uploading this resource. I have included it as part of a GCSE Statistics SOW.
THANKS FOR SHARING, A NICE STARTER TASK TO ENGAGE STUDENTS THINKING OF A AVERAGES.
Nice activity and gets the pupils talking about which average is best in each situation. Thanks for sharing :-)
Report this resourceto let us know if it violates our terms and conditions.
Our customer service team will review your report and will be in touch.
£0.00