

271Uploads
2053k+Views
2012k+Downloads
All resources
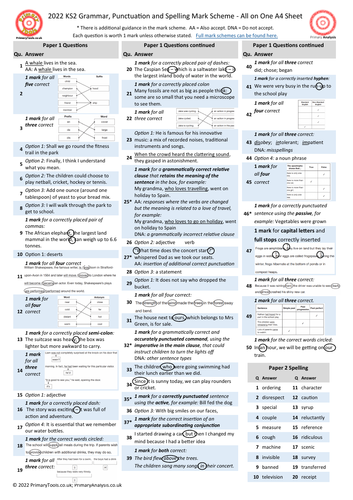
2022 KS2 SATs Grammar, Punctuation and Spelling Test Mark Scheme on a Page
2022 KS2 SATs Grammar, Punctuation and Spelling Test Mark Scheme on a Page
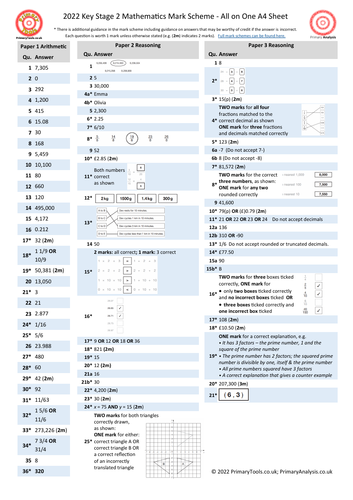
2022 KS2 SATs Mathematics Test Mark Scheme on a Page
2022 KS2 SATs Mathematics Test Mark Scheme on a Page
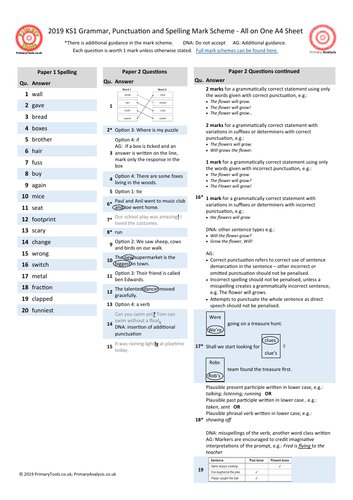
KS1 and KS2 2019 Grammar Punctuation and Spelling Mark Scheme on a Page
KS1 and KS2 2019 Grammar Punctuation and Spelling Mark Scheme on a Page

KS1 and KS2 2019 Maths Mark Scheme on a Page
KS1 and KS2 2019 Grammar Punctuation and Spelling Mark Scheme on a Page

KS2 National Curriculum Tests Comparison - 2016 onwards (updated with 2023 tests)
An analysis and comparison of the KS2 National Curriculum Tests (SATs) from 2016 onwards.

Multiplication / Times Tables Spinner Games
For the following times tables:
x2, x3, x4, x5,x6, x7, x8, x9, x10, x11, x12
Level D (Practice): Yellow, Answers and Arrays
Level C: Blue, Arrays only
Level B: Red, Questions only, in order
Level A: Rainbow, Questions only in random order
Bonus spinner for useful multiplication facts: x20, x25, x0.1,x 0.2, x0.01, x0.02
Bonus spinner for tricky division
Bonus spinner for square numbers
Bonus spinner for measurement conversion
Print, cut, laminate, cut, cut hole, insert spinner - done!
A minor hint if you want to save on time and preparation is to print just level C and A only and glue back to back before laminating. The spinner can then be reversed when needed.
Spinners can be bought for just a few pounds from ebay etc

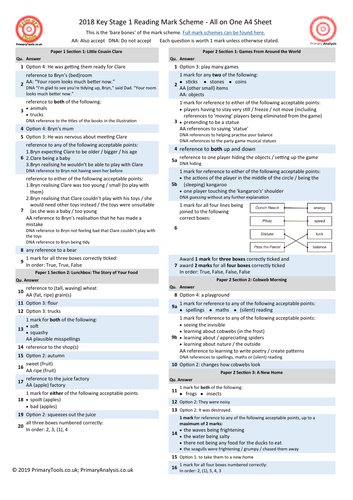
2019 KS1 Reading Test and Question Level Analysis
Summary of Features (please note some features may not be available depending on the test type):
Pupil Summary shows total marks for each paper, number of questions unanswered (possibly indicating need to increase pace), number of incorrect answers, total overall score (and percent), total score in each strand. Option to adjust the colour thresholds to make it easier to spot patterns and gaps.
Pupil Reports show a summary of performance in each strand for an individual pupils. Available in 2017 versions and later excluding reading. 2018 versions and later contain detailed feedback on each question. Useful for feeding back to pupils, parents and informing intervention teachers.
Cohort Summary shows an overview of the cohort against each strand. This is also compared to national data where it is available. This page gives a summary of attainment including number and percent at expected and higher standard.
Strand Summary shows a the weighting of each strand and the performance within it. For example, in a grammar test a cohort may perform poorly in identifying sentence types and equally poorly in identifying punctuation. However as there is more weighting given to punctuation, it would be advisable to focus on this area.
Other Charts Charts which show performance for each question, organised by most correct to incorrect, by strand and also by year group question (for mathematics). The most powerful chart orders questions from most correct to incorrect enabling you to see precisely where there are strengths and weaknesses.

2019 KS1 Grammar, Punctuation & Spelling Test and Question Level Analysis
Summary of Features (please note some features may not be available depending on the test type):
Pupil Summary shows total marks for each paper, number of questions unanswered (possibly indicating need to increase pace), number of incorrect answers, total overall score (and percent), total score in each strand. Option to adjust the colour thresholds to make it easier to spot patterns and gaps.
Pupil Reports show a summary of performance in each strand for an individual pupils. Available in 2017 versions and later excluding reading. 2018 versions and later contain detailed feedback on each question. Useful for feeding back to pupils, parents and informing intervention teachers.
Cohort Summary shows an overview of the cohort against each strand. This is also compared to national data where it is available. This page gives a summary of attainment including number and percent at expected and higher standard.
Strand Summary shows a the weighting of each strand and the performance within it. For example, in a grammar test a cohort may perform poorly in identifying sentence types and equally poorly in identifying punctuation. However as there is more weighting given to punctuation, it would be advisable to focus on this area.
Other Charts Charts which show performance for each question, organised by most correct to incorrect, by strand and also by year group question (for mathematics). The most powerful chart orders questions from most correct to incorrect enabling you to see precisely where there are strengths and weaknesses.

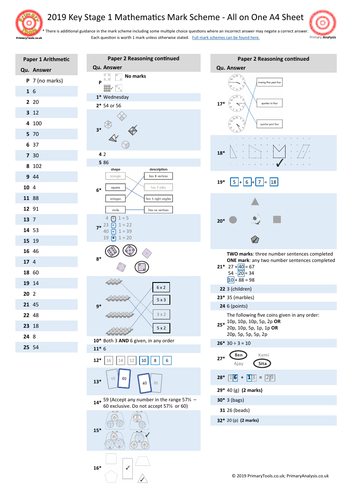
2019 KS1 Mathematics Question Level Analysis
Summary of Features (please note some features may not be available depending on the test type):
Pupil Summary shows total marks for each paper, number of questions unanswered (possibly indicating need to increase pace), number of incorrect answers, total overall score (and percent), total score in each strand. Option to adjust the colour thresholds to make it easier to spot patterns and gaps.
Pupil Reports show a summary of performance in each strand for an individual pupils. Available in 2017 versions and later excluding reading. 2018 versions and later contain detailed feedback on each question. Useful for feeding back to pupils, parents and informing intervention teachers.
Cohort Summary shows an overview of the cohort against each strand. This is also compared to national data where it is available. This page gives a summary of attainment including number and percent at expected and higher standard.
Strand Summary shows a the weighting of each strand and the performance within it. For example, in a grammar test a cohort may perform poorly in identifying sentence types and equally poorly in identifying punctuation. However as there is more weighting given to punctuation, it would be advisable to focus on this area.
Other Charts Charts which show performance for each question, organised by most correct to incorrect, by strand and also by year group question (for mathematics). The most powerful chart orders questions from most correct to incorrect enabling you to see precisely where there are strengths and weaknesses.

2019 KS2 Reading Test and Question Level Analysis
Summary of Features (please note some features may not be available depending on the test type):
Pupil Summary shows total marks for each paper, number of questions unanswered (possibly indicating need to increase pace), number of incorrect answers, total overall score (and percent), total score in each strand. Option to adjust the colour thresholds to make it easier to spot patterns and gaps.
Pupil Reports show a summary of performance in each strand for an individual pupils. Available in 2017 versions and later excluding reading. 2018 versions and later contain detailed feedback on each question. Useful for feeding back to pupils, parents and informing intervention teachers.
Cohort Summary shows an overview of the cohort against each strand. This is also compared to national data where it is available. This page gives a summary of attainment including number and percent at expected and higher standard.
Strand Summary shows a the weighting of each strand and the performance within it. For example, in a grammar test a cohort may perform poorly in identifying sentence types and equally poorly in identifying punctuation. However as there is more weighting given to punctuation, it would be advisable to focus on this area.
Other Charts Charts which show performance for each question, organised by most correct to incorrect, by strand and also by year group question (for mathematics). The most powerful chart orders questions from most correct to incorrect enabling you to see precisely where there are strengths and weaknesses.

2019 KS2 Grammar, Punctuation & Spelling Test and Question Level Analysis
Summary of Features (please note some features may not be available depending on the test type):
Pupil Summary shows total marks for each paper, number of questions unanswered (possibly indicating need to increase pace), number of incorrect answers, total overall score (and percent), total score in each strand. Option to adjust the colour thresholds to make it easier to spot patterns and gaps.
Pupil Reports show a summary of performance in each strand for an individual pupils. Available in 2017 versions and later excluding reading. 2018 versions and later contain detailed feedback on each question. Useful for feeding back to pupils, parents and informing intervention teachers.
Cohort Summary shows an overview of the cohort against each strand. This is also compared to national data where it is available. This page gives a summary of attainment including number and percent at expected and higher standard.
Strand Summary shows a the weighting of each strand and the performance within it. For example, in a grammar test a cohort may perform poorly in identifying sentence types and equally poorly in identifying punctuation. However as there is more weighting given to punctuation, it would be advisable to focus on this area.
Other Charts Charts which show performance for each question, organised by most correct to incorrect, by strand and also by year group question (for mathematics). The most powerful chart orders questions from most correct to incorrect enabling you to see precisely where there are strengths and weaknesses.

2019 KS2 Mathematics Question Level Analysis
Summary of Features (please note some features may not be available depending on the test type):
Pupil Summary shows total marks for each paper, number of questions unanswered (possibly indicating need to increase pace), number of incorrect answers, total overall score (and percent), total score in each strand. Option to adjust the colour thresholds to make it easier to spot patterns and gaps.
Pupil Reports show a summary of performance in each strand for an individual pupils. Available in 2017 versions and later excluding reading. 2018 versions and later contain detailed feedback on each question. Useful for feeding back to pupils, parents and informing intervention teachers.
Cohort Summary shows an overview of the cohort against each strand. This is also compared to national data where it is available. This page gives a summary of attainment including number and percent at expected and higher standard.
Strand Summary shows a the weighting of each strand and the performance within it. For example, in a grammar test a cohort may perform poorly in identifying sentence types and equally poorly in identifying punctuation. However as there is more weighting given to punctuation, it would be advisable to focus on this area.
Other Charts Charts which show performance for each question, organised by most correct to incorrect, by strand and also by year group question (for mathematics). The most powerful chart orders questions from most correct to incorrect enabling you to see precisely where there are strengths and weaknesses.

2017 Phonics Check Question Level Analysis
Summary of Features:
Pupil Summary shows total marks for each paper, number of questions unanswered, number of incorrect answers, total overall score (and percent), total score in each focus area. Option to adjust the colour thresholds to make it easier to spot patterns and gaps.
Pupil Reports show a summary of performance in each focus area for an individual pupil. Useful for feeding back to pupils, parents and informing intervention teachers.
Cohort Summary shows an overview of the cohort against each focus area. This page gives a summary of attainment including number and percent meeting the expected standard.
Other Charts Charts which show performance for each question, organised by most correct to incorrect and by word type.
Requires Excel with macros enabled.

2018 Phonics Check Question Level Analysis
Summary of Features:
Pupil Summary shows total marks for each paper, number of questions unanswered, number of incorrect answers, total overall score (and percent), total score in each focus area. Option to adjust the colour thresholds to make it easier to spot patterns and gaps.
Pupil Reports show a summary of performance in each focus area for an individual pupil. Useful for feeding back to pupils, parents and informing intervention teachers.
Cohort Summary shows an overview of the cohort against each focus area. This page gives a summary of attainment including number and percent meeting the expected standard.
Other Charts Charts which show performance for each question, organised by most correct to incorrect and by word type.
Requires Excel with macros enabled.

2019 Phonics Check Question Level Analysis
Summary of Features:
Pupil Summary shows total marks for each paper, number of questions unanswered, number of incorrect answers, total overall score (and percent), total score in each focus area. Option to adjust the colour thresholds to make it easier to spot patterns and gaps.
Pupil Reports show a summary of performance in each focus area for an individual pupil. Useful for feeding back to pupils, parents and informing intervention teachers.
Cohort Summary shows an overview of the cohort against each focus area. This page gives a summary of attainment including number and percent meeting the expected standard.
Other Charts Charts which show performance for each question, organised by most correct to incorrect and by word type.
Requires Excel with macros enabled.

2019 Phonics Check - PowerPoint and PDF Version
The 2019 Phonics Check presented in Powerpoint and PDF.
