I create mathematics powerpoint and other resources for Key Stages 1, 2, 3 & 4, which are designed to clearly explain topics. These can be presented by the teacher, or accessed by individual students.
I can create bespoke resources.
Most KS2 and KS4 Maths Topics are in Bundles, as are the KS1 Powerpoint Mental Starters, or available separately If you'd like a bespoke bundle, please tell me the items you would like in it, and I will do this, at a discount of about 30% off total price.
A Powerpoint to explain Pie Charts. The new powerpoint has 15 slides (Including one title and one end slide). Designed for KS2.
This covers:
Introducing Pie Charts
Values from Pie Charts
Drawing Pie Charts
The original powerpoint is also included.
A bright and stimulating Powerpoint to explain Negative Numbers. This powerpoint has 12 slides (Plus one title and one end slide). Designed for KS2.
The topics in the powerpoint are:
Negative Numbers
Negative Numbers: A Number Line
Putting Negative Numbers in the Correct Order
Adding and Subtracting Negative Numbers
Both the original powerpoint, and the new one (with new title and end slides) are included.
A Powerpoint looking at Line Graphs. plus a two sided A4 PDF worksheet.
The powerpoint has 14 slides (Plus one title and one end slide).
There are four examples looking at how to draw line graphs, followed by 10 example questions based on the 4th Line graph drawn.
The worksheet has two questions involving drawing line graphs from a given table of data, and a third question has 10 individual questions to be answered based on a given line graph.
Designed for KS2.
Fully Up to Date.
A fantastic collection of 135 Powerpoint Presentations to explain Maths Topics at KS4.
An invaluable resources for your entire teaching career.
Some key features:
• Number, Algebra, Shape, Handling Data, Ratio, Measures are all included.
• Powerpoints clearly explain topics, with examples.
• Work through explanations can be used by teacher, or pupil to work on their own.
• Variable numbers of slides depending on topics. Some topics have a few slides, others have up to 30 or so.
• Save time planning explanations.
• Make topics clear and easy for pupils to understand.
This price is for one individual user (Unless you purchase the full school licence), and at less than 50p per powerpoint, this offers exceptional value. I’ll only keep them at this price for a short time, to allow everyone to be able to afford these.
You can also purchase a school licence here.
I’ve included some PDFs which show up in the preview, so that you can see a slide from each of the powerpoints, and there’s also a list of all the presentations available.
All the powerpoints are available individually in my shop should you wish to purchase an individual one.
You may be interested in a couple of my free resources (Created a while ago, and not necessarily the same format):
[https://www.tes.com/teaching-resource/fidget-spinner-maths-free-version-11899468]
[https://www.tes.com/teaching-resource/christmas-maths-powerpoints-3-free-powerpoints-11789606]
A Powerpoint to explain Tally Charts, together with four pdf worksheets.
This powerpoint has 7 slides (Plus one title and one end slide). Designed for KS2. There are three fully animated Tally charts, which shows the tally marks being added as the items appear (each item appears as the teacher clicks the powerpoint forward, and a bar chart follows each one.
PDF Worksheets (all of which have a version with the answers filled in) are:
A one-sided A4 worksheet so pupils can fill in their own tally charts as the animations appear on screen in the powerpoint, and draw the bar charts themselves.
A one sided A4 worksheet entitled “Monarchs of England and the UK: Tally Charts” where data relating to the length of reign of a number of monarchs is give to the nearest year, and this can be used to fill in the tally chart and draw a bar chart.
A one sided A4 worksheet entitled “Gases in the Air: Tally Chart and Bar Chart” . Here 40 people have given the name of one of the six gases in the air, and pupils make a tally chart of this data, and then draw a bar chart.
A one sided A4 worksheet entitled “Trees in a Wood: Tally Chart and Bar Chart” . Here 60 trees are given (6 different types), and pupils make a tally chart of this data, and then draw a bar chart.
I’ve also left the original powerpoint, which only has the tally charts.
Updated on 31st June 2018
A short Powerpoint to explain Graphs of Trigonometric Functions. This powerpoint has 5 slides (Including one title and one end slide). Designed for KS4 / GCSE.
Graphs covered are:
Graph of y = sin x
Graph of y = cos x
Graph of y = tan x
Here we have four bright and colourful Powerpoint Mental Starters from our popular series. Each starter has 20 questions, where the answer follows each question.
The titles for these Mental Starters are:
Bar Chart Questions
Dual Bar Diagrams
Frequency Bar Charts
Frequency Tables
Here we have 6 bright and colourful Powerpoint Mental Starters from our popular series. Each starter has 20 questions, where the answer follows each question.
The titles for these Mental Starters are:
Difference of Squares Calculations
HCF
Prime or Not?
Rational or Irrational?
Rounding
Upper and Lower Bounds
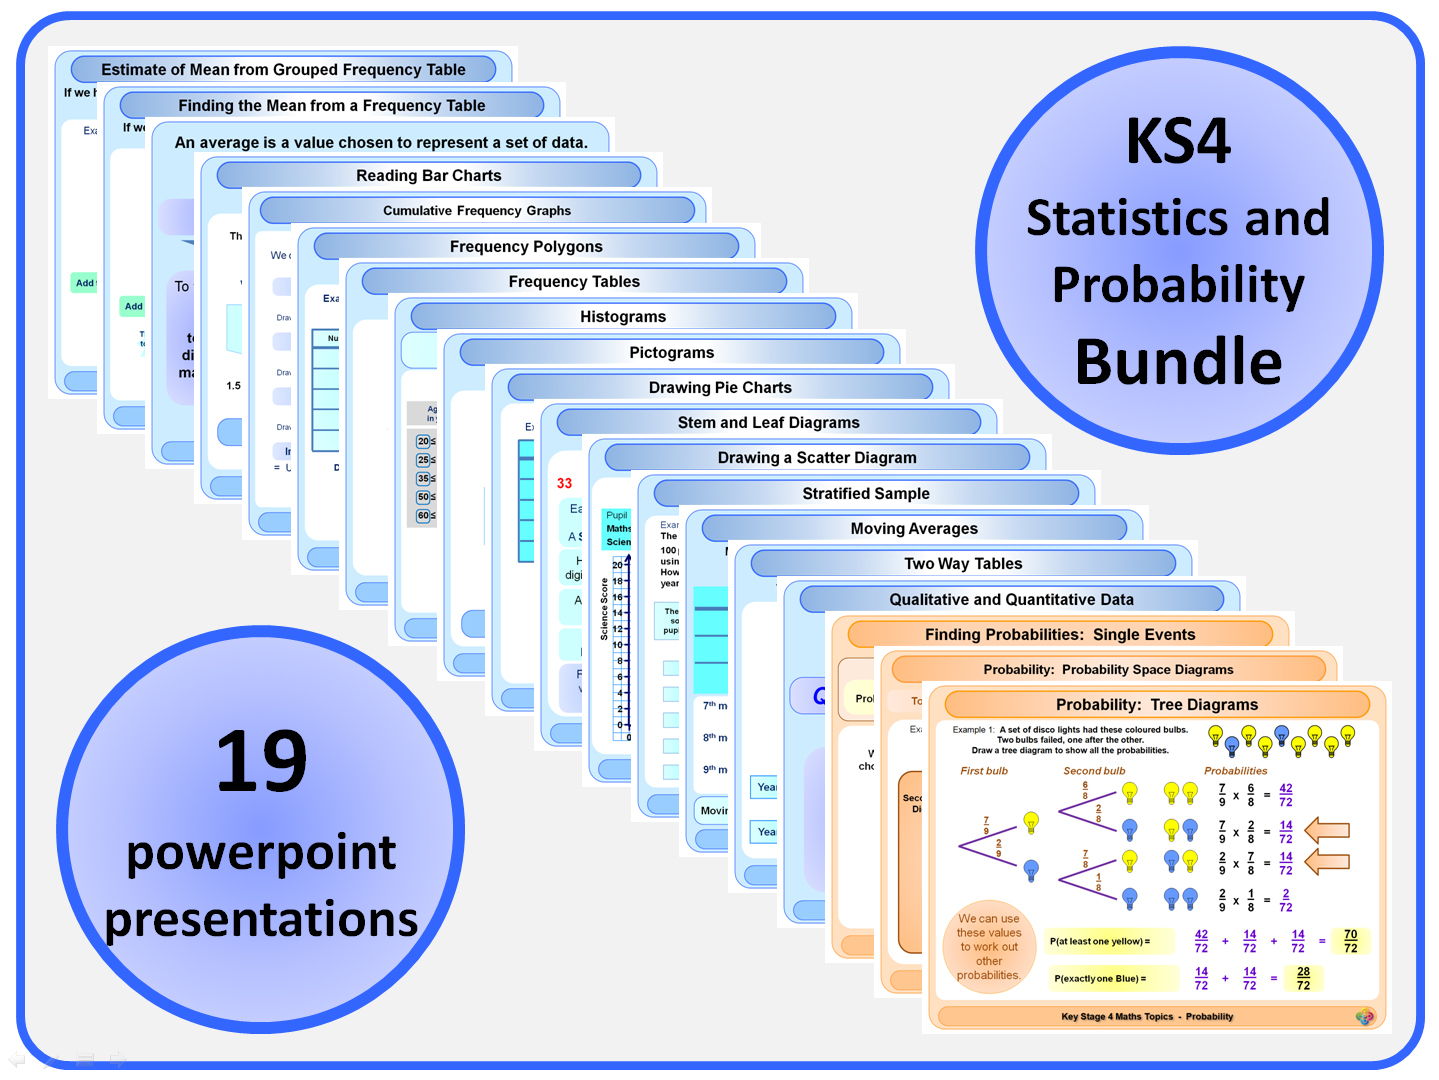
A Powerpoint to explain Types of Data. This powerpoint has 18 slides (Including one title and one end slide). Designed for KS4 / GCSE.
This covers:
Qualitative and Quantitative Data
Discrete and Continuous Data
Also included is a one sided A4 pdf worksheet, containing 15 questions where pupils have to tick the relevant box to indicate the type of data given. Answers are also given.
Factors, Multiples and Primes for KS3
This individual powerpoint presentation is from the KS3 Maths Topics Series.
It contains 54 slides (Plus a title and end slide), so there are lots of examples. This is an ideal resource which you will enjoy using to explain Facotrs, Multiples and Primes to your classes for years to come.
The powerpoint explains:
Prime Numbers & Finding Prime Numbers
Factors
Common Factor
Highest Common Factor
Multiples
Common Multiple
Lowest Common Multiple
Writing a Number as a Product of Prime Factors
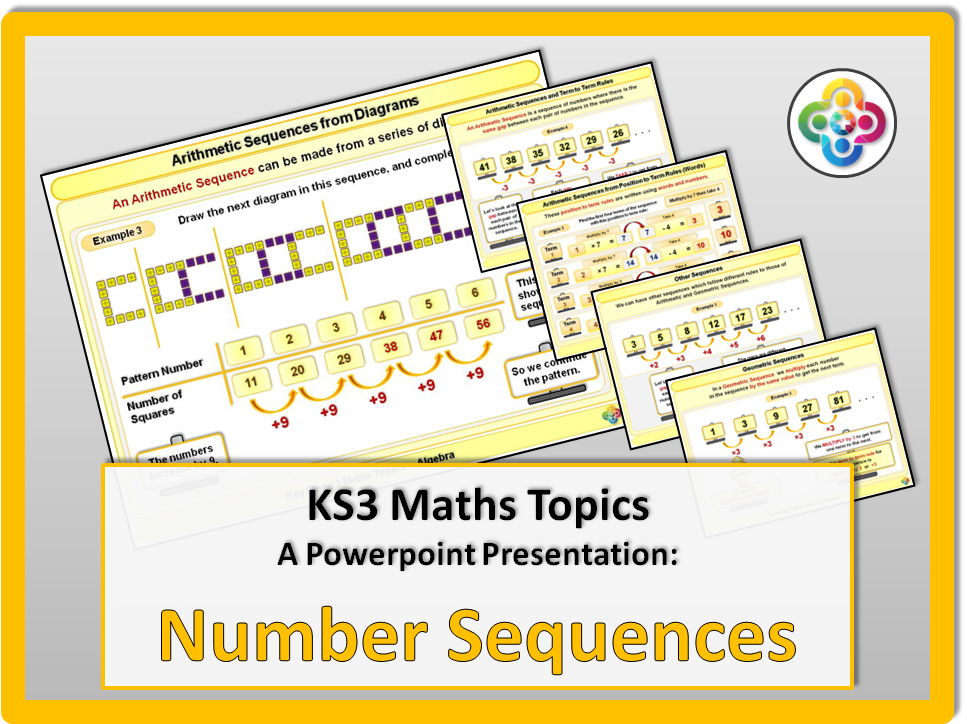
Number Sequences KS3
This individual powerpoint presentation is from the KS3 Maths Topics Series.
It contains 51 slides (Plus a title and end slide), so there are lots of examples. This is an ideal resource which you will enjoy using to explain Number Sequences to your classes for years to come.
The powerpoint explains:
Number Sequences
Arithmetic Sequences and Term to Term Rules
Arithmetic Sequences from Diagrams
Arithmetic Sequences from Position to Term Rules (Words)
Arithmetic Sequences from Position to Term Rules (Letters)
Finding the Rule for an Arithmetic Sequence
Drawing Graphs of Arithmetic Sequences
Geometric Sequences
Other Sequences
Read less
A short Powerpoint to explain how to find the midpoint of a line segment. This powerpoint has 6 slides (Including one title and one end slide). Designed for KS4 / GCSE.
A bright and colourful Powerpoint to explain Bar Charts, plus a two sided A4 pdf worksheet. This powerpoint has 18 slides (Plus one title and one end slide). Designed for KS2. The powerpoint covers bar charts with vertical bars and also with horizontal bars.
The worksheet, “Rainfall Bar Charts” has a bar chart on side 1 with 10 questions, and pupils are asked to draw another bar chart on side 2 and answer 10 more questions about this.
Revised 23 May 2020
A Powerpoint to explain the Product Rule for Counting. This powerpoint has 16 slides (PLUS one title and one end slide).
The first slide gives the main rule, and there are:
4 slides with examples which show how to find the number of possibilities, together with a tree diagram to show these,
1 information slide,
10 slides with examples using larger numbers, situations where are there more than two “events”, or situations where there are duplicate possibilities (doubles), requiring multiplication then halving.
Revised with more slides on: 26 Feb 2020
Designed for KS4 / GCSE.
This powerpoint is designed to clearly explain Division using the chunking method to Key Stage 2 pupils. You’ll love the clarity of the explanations here, and pupils will love this.
DIvision by single digit numbers and division by two digit numbers is considered. There are 14 slides, including one title and one end slide. There are 12 examples of calculations shown.
Place Value for KS3
This individual powerpoint presentation is from the KS3 Maths Topics Series.
It contains 20 slides (Plus a title and end slide), so there are lots of examples. This is an ideal resource which you will enjoy using to explain Place Value to your classes for years to come.
The powerpoint explains:
Place Value: Whole Numbers
Place Value: Decimals
Finding the Value of Digits in Numbers
A Powerpoint to explain how to find Best Value for Money. This powerpoint has 8 slides (Plus one title and one end slide), so there are five examples in total. Designed for KS2.
Also included is a two sided A4 PDF worksheet, containing 12 questions. Full answers are also provided
Both the original powerpoint and the newly designed one are included
This looks at types of Numbers: Natural, Integers, Rational and Real. Then Factors, Prime Number and Prime Factor. It looks at a method for writing numbers as a product of Prime Factors, and then a way of writing terminating and recurring decimals as fractions. You will need Powerpoint 2003 or later for the animarions to work properly. Hope you find it useful.
Other topics covered: Numbers
This is one of my much earlier works - My paid products are much better :)
Edited on 5 July 2018