Key Stage 3 level tracker unprotected version Year 7 - 9 (4 classes per year)Quick View
gavinmachellgavinmachell

Key Stage 3 level tracker unprotected version Year 7 - 9 (4 classes per year)

(4)
Excel (Office 2007 - macro enabled) workbook that provides a visual track of pupil progress. This is designed for a Year 7 Science class of 25 students. Once baseline data is entered (either Y6 SAT or Sept. baseline test results or both) then a class average is plotted (red) together with a 3 sub level increase target for the class (Outstanding). NC expectations are also shown. Individual students can be added or removed from the graphic at will. As it is based on NC Y7 Science, which I teach two units at a time, data points that are plotted are an average of two levelled tasks every six weeks or so. Could easily be adapted for any KS3 subject. I've removed the protection on this version so that it can be adapted to individual needs. I'd be happy to entertain any suggestions for improvements or adaptations. I have added sufficient sheets for 4 classes of 25 students in each of Years 7,8 and 9. Adding more sheets by copying existing ones can be done but every student needs to be checked in the sheet you are copying before you make the copy. If this is not done then the copied chart remains linked to the original data in the sheet it was copied from. I am really conflicted about charging for this, but at the end of the day, adapting it and making it "generic" has taken quite some time. I generally use a free CC license but since there are several commercial products that offer similar functionality I feel entitled to profit from my meagre efforts.
A6 sized flashcards with the IGCSE Chem syllabusQuick View
gavinmachellgavinmachell

A6 sized flashcards with the IGCSE Chem syllabus

(8)
A6 sized pages can be printed out 4 to an A4 page and then sliced and diced to make a handy pack of 44 cards that might form the basis of revision notes. (Some bright spark might turn them into an e-book for iPhone for us all too!)
KS3 LEVEL TRACKER (Science)Quick View
gavinmachellgavinmachell

KS3 LEVEL TRACKER (Science)

(6)
Excel (Office 2007 - macro enabled) workbook that provides a visual track of pupil progress. This is designed for a Year 7 Science class of 25 students. Once baseline data is entered (either Y6 SAT or Sept. baseline test results or both) then a class average is plotted (red) together with a 3 sub level increase target for the class (Outstanding). NC expectations are also shown. Individual students can be added or removed from the graphic at will. As it is based on NC Y7 Science, which I teach two units at a time, data points that are plotted are an average of two levelled tasks every six weeks or so. Could easily be adapted for any KS3 subject. The workbook is protected but students and their levels can be changed as well as the dates of the assessed tasks. Everything else is automatic. Thanks for the feedback. I have updated things for the 2015/16 academic year. I'll post an unprotected version of this later for those that want to adapt and change things further. I have worked on adding more classes for Years 8 and 9 so that it is a complete KS3 solution for a four form entry school. This version can be found here https://www.tes.com/teaching-resource/key-stage-3-level-tracker-unprotected-version-year-7-9-4-classes-per-year-11120431 More suggestions welcome.
Common ions jigsawQuick View
gavinmachellgavinmachell

Common ions jigsaw

(2)
Adapted from the original design by user supplymike (found here: http://www.tes.co.uk/teaching-resource/Ionic-Jigsaw-3001711/ ) This version is in colour and requires less scissor work to cut out the ions. As with other versions, best laminated and kept for future classes. Enlarged version can have magnetic strips added for use on a magnetic whiteboard if you have one. This version is modelled on something I found in a school supplies shop in Bangkok 20 years ago! Tasks remain the same. Publisher file if you want to edit, also a pdf file for those without Publisher.
Taking the Sun's TemperatureQuick View
gavinmachellgavinmachell

Taking the Sun's Temperature

(2)
Every time I do this I am amazed at how close we get to 6000K. Of course, the nature of Stefan's Law helps and all the errors and assumptions seem to cancel each other out. Admittedly, I have always done this experiment in either Thailand or Vietnam where it is rather sunny, but it might work well on a summer&'s day in UK. Today, we put a cylindrical (8.3cm high x 4.4cm diameter) 1kg copper calorimetry block out in the sun for 6 minutes and it&';s temperature rose from 34 to 39 C. Plug these numbers into the attached worksheet and we get a surface temp of 5900K
Chemical Curiosities with Chris BishopQuick View
gavinmachellgavinmachell

Chemical Curiosities with Chris Bishop

(2)
This is a run-through of the lecture created for the Royal Institution by Prof. Chris Bishop. There are around 25 demonstrations in the video, I find it a great resource to dip into for particular experiments, along with Chris' excellent commentary. Finding the right demo is tricky unless you know the timings - hence this run-through.
Times Higher Ed. Global Uni Rank by SubjectQuick View
gavinmachellgavinmachell

Times Higher Ed. Global Uni Rank by Subject

(0)
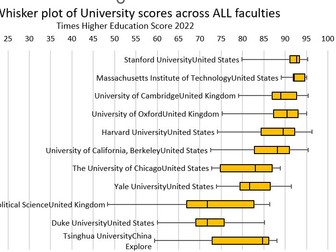
This is an Excel Sheet that plots box and whisker diagrams of the range of Faculty Scores within any given university. These plots clearly show the lowest scoring subject, bottom quartile, median, upper quartile and top scoring subject. The raw data is from August 2022. I have always discouraged students from talking of university rankings and always said that there can be as much variation within any university than between universities. This sheet enables exploration of that idea. It’s not particularly useful as far as selecting a particular course is concerned but it does allow some interesting comparisons between universities to be visualized.