

271Uploads
2053k+Views
2012k+Downloads
All resources
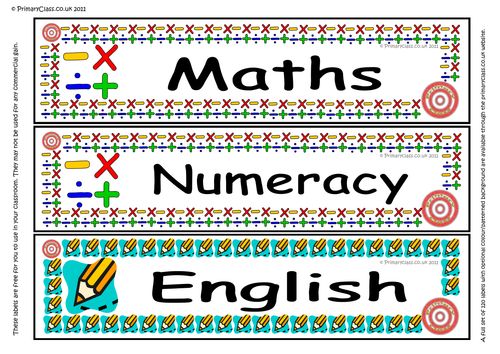
48 Quality Classroom Tray or Drawer Labels
48 labels from the website in 3 different sizes: small: 3.2x 13cm, medium 4.2x17.3cm and large 6.3x29.5cm.

2017 KS2 National Curriculum Test for Reading Electronic Analysis
Works best in Excel 2010 or later with macros enabled
New features for the 2017 version include Age Related Expectations reporting and improved presentation of graphs

Fraction, Decimal and Percentages Conversion Line
Printable tool to help help convert between fractions decimals and percentages. elementary-class.com

2022 KS1 SATs Grammar, Punctuation and Spelling Test and Question Level Analysis
2022 KS1 Grammar, Punctuation and Spelling Test and Question Level Analysis
Requires Excel with macros enabled.
Summary of Features (please note some features may not be available depending on the test type):
Pupil Summary shows total marks for each paper, number of questions unanswered (possibly indicating need to increase pace), number of incorrect answers, total overall score (and percent), total score in each strand. Option to adjust the colour thresholds to make it easier to spot patterns and gaps.
Pupil Reports show a summary of performance in each strand and per question for an individual pupils. Useful for feeding back to pupils, parents and informing intervention teachers.
Contextual Analysis shows a breakdown by key groups (gender, SEND status, disadvantaged, EAL) plus up to four custom groups. Compares school data (grades and scaled scores) to national data in a detailed but user-friendly report.
Cohort Summary shows an overview of the cohort against each strand. This is also compared to national data where it is available. This page gives a summary of attainment including number and percent at expected and higher standard.
Strand Summary shows a the weighting of each strand and the performance within it. For example, in a grammar test a cohort may perform poorly in identifying sentence types and equally poorly in identifying punctuation. However as there is more weighting given to punctuation, it would be advisable to focus on this area.
Other Charts Charts which show performance for each question, organised by most correct to incorrect, by strand and also by year group question (for mathematics). The most powerful chart orders questions from most correct to incorrect enabling you to see precisely where there are strengths and weaknesses.

2022 KS2 Mathematics Test and Question Level Analysis
2022 KS2 Mathematics Test and Question Level Analysis
Requires Excel with macros enabled.
Summary of Features (please note some features may not be available depending on the test type):
Questions Versus National compares the performance of your cohort against the performance of pupils nationally in each question. A powerful chart which instantly shows you which questions you are strong or weak on. As it uses national data, it considers the difficulty of each question, compares it the performance of your cohort and orders the results from strongest to weakest. 2016 to 2022 KS2 versions only, Q vs National will be added to the 2023 KS2 version at a later date.
Pupil Summary shows total marks for each paper, number of questions unanswered (possibly indicating need to increase pace), number of incorrect answers, total overall score (and percent), total score in each strand. Option to adjust the colour thresholds to make it easier to spot patterns and gaps.
Pupil Reports show a summary of performance in each strand for an individual pupils. Available in 2017 versions and later excluding reading. 2018 versions and later contain detailed feedback on each question. Useful for feeding back to pupils, parents and informing intervention teachers.
Contextual Analysis (2019 versions onwards) shows a breakdown by key groups (gender, SEND status, disadvantaged, EAL) plus up to four custom groups. Compares school data (grades and scaled scores) to national data in a detailed but user-friendly report.
Cohort Summary shows an overview of the cohort against each strand. This is also compared to national data where it is available. This page gives a summary of attainment including number and percent at expected and higher standard.
Strand Summary shows a the weighting of each strand and the performance within it. For example, in a grammar test a cohort may perform poorly in identifying sentence types and equally poorly in identifying punctuation. However as there is more weighting given to punctuation, it would be advisable to focus on this area.
Other Charts Charts which show performance for each question, organised by most correct to incorrect, by strand and also by year group question (for mathematics). The most powerful chart orders questions from most correct to incorrect enabling you to see precisely where there are strengths and weaknesses.
2022 KS2 Mathematics Test and Question Level Analysis

2022 KS1 SATs Mathematics Test and Question Level Analysis
2022 KS1 Mathematics Test and Question Level Analysis
Requires Excel with macros enabled.
Summary of Features (please note some features may not be available depending on the test type):
Pupil Summary shows total marks for each paper, number of questions unanswered (possibly indicating need to increase pace), number of incorrect answers, total overall score (and percent), total score in each strand. Option to adjust the colour thresholds to make it easier to spot patterns and gaps.
Pupil Reports show a summary of performance in each strand and per question for an individual pupils. Useful for feeding back to pupils, parents and informing intervention teachers.
Contextual Analysis shows a breakdown by key groups (gender, SEND status, disadvantaged, EAL) plus up to four custom groups. Compares school data (grades and scaled scores) to national data in a detailed but user-friendly report.
Cohort Summary shows an overview of the cohort against each strand. This is also compared to national data where it is available. This page gives a summary of attainment including number and percent at expected and higher standard.
Strand Summary shows a the weighting of each strand and the performance within it. For example, in a grammar test a cohort may perform poorly in identifying sentence types and equally poorly in identifying punctuation. However as there is more weighting given to punctuation, it would be advisable to focus on this area.
Other Charts Charts which show performance for each question, organised by most correct to incorrect, by strand and also by year group question (for mathematics). The most powerful chart orders questions from most correct to incorrect enabling you to see precisely where there are strengths and weaknesses.

2019 KS1 Grammar, Punctuation & Spelling Test and Question Level Analysis
Summary of Features (please note some features may not be available depending on the test type):
Pupil Summary shows total marks for each paper, number of questions unanswered (possibly indicating need to increase pace), number of incorrect answers, total overall score (and percent), total score in each strand. Option to adjust the colour thresholds to make it easier to spot patterns and gaps.
Pupil Reports show a summary of performance in each strand for an individual pupils. Available in 2017 versions and later excluding reading. 2018 versions and later contain detailed feedback on each question. Useful for feeding back to pupils, parents and informing intervention teachers.
Cohort Summary shows an overview of the cohort against each strand. This is also compared to national data where it is available. This page gives a summary of attainment including number and percent at expected and higher standard.
Strand Summary shows a the weighting of each strand and the performance within it. For example, in a grammar test a cohort may perform poorly in identifying sentence types and equally poorly in identifying punctuation. However as there is more weighting given to punctuation, it would be advisable to focus on this area.
Other Charts Charts which show performance for each question, organised by most correct to incorrect, by strand and also by year group question (for mathematics). The most powerful chart orders questions from most correct to incorrect enabling you to see precisely where there are strengths and weaknesses.

2019 KS1 Mathematics Question Level Analysis
Summary of Features (please note some features may not be available depending on the test type):
Pupil Summary shows total marks for each paper, number of questions unanswered (possibly indicating need to increase pace), number of incorrect answers, total overall score (and percent), total score in each strand. Option to adjust the colour thresholds to make it easier to spot patterns and gaps.
Pupil Reports show a summary of performance in each strand for an individual pupils. Available in 2017 versions and later excluding reading. 2018 versions and later contain detailed feedback on each question. Useful for feeding back to pupils, parents and informing intervention teachers.
Cohort Summary shows an overview of the cohort against each strand. This is also compared to national data where it is available. This page gives a summary of attainment including number and percent at expected and higher standard.
Strand Summary shows a the weighting of each strand and the performance within it. For example, in a grammar test a cohort may perform poorly in identifying sentence types and equally poorly in identifying punctuation. However as there is more weighting given to punctuation, it would be advisable to focus on this area.
Other Charts Charts which show performance for each question, organised by most correct to incorrect, by strand and also by year group question (for mathematics). The most powerful chart orders questions from most correct to incorrect enabling you to see precisely where there are strengths and weaknesses.

2019 KS2 Grammar, Punctuation & Spelling Test and Question Level Analysis
Summary of Features (please note some features may not be available depending on the test type):
Pupil Summary shows total marks for each paper, number of questions unanswered (possibly indicating need to increase pace), number of incorrect answers, total overall score (and percent), total score in each strand. Option to adjust the colour thresholds to make it easier to spot patterns and gaps.
Pupil Reports show a summary of performance in each strand for an individual pupils. Available in 2017 versions and later excluding reading. 2018 versions and later contain detailed feedback on each question. Useful for feeding back to pupils, parents and informing intervention teachers.
Cohort Summary shows an overview of the cohort against each strand. This is also compared to national data where it is available. This page gives a summary of attainment including number and percent at expected and higher standard.
Strand Summary shows a the weighting of each strand and the performance within it. For example, in a grammar test a cohort may perform poorly in identifying sentence types and equally poorly in identifying punctuation. However as there is more weighting given to punctuation, it would be advisable to focus on this area.
Other Charts Charts which show performance for each question, organised by most correct to incorrect, by strand and also by year group question (for mathematics). The most powerful chart orders questions from most correct to incorrect enabling you to see precisely where there are strengths and weaknesses.

2017 Phonics Check Question Level Analysis
Summary of Features:
Pupil Summary shows total marks for each paper, number of questions unanswered, number of incorrect answers, total overall score (and percent), total score in each focus area. Option to adjust the colour thresholds to make it easier to spot patterns and gaps.
Pupil Reports show a summary of performance in each focus area for an individual pupil. Useful for feeding back to pupils, parents and informing intervention teachers.
Cohort Summary shows an overview of the cohort against each focus area. This page gives a summary of attainment including number and percent meeting the expected standard.
Other Charts Charts which show performance for each question, organised by most correct to incorrect and by word type.
Requires Excel with macros enabled.

2018 Phonics Check Question Level Analysis
Summary of Features:
Pupil Summary shows total marks for each paper, number of questions unanswered, number of incorrect answers, total overall score (and percent), total score in each focus area. Option to adjust the colour thresholds to make it easier to spot patterns and gaps.
Pupil Reports show a summary of performance in each focus area for an individual pupil. Useful for feeding back to pupils, parents and informing intervention teachers.
Cohort Summary shows an overview of the cohort against each focus area. This page gives a summary of attainment including number and percent meeting the expected standard.
Other Charts Charts which show performance for each question, organised by most correct to incorrect and by word type.
Requires Excel with macros enabled.

2018 KS2 National Curriculum (SATs) Test Analysis for Grammar, Punctuation and Spelling
2018 KS2 National Curriculum (SATs) Test Analysis for Grammar, Punctuation and Spelling.
Please see release notes for new features.
Analysis for all tests is available elsewhere on TES or from our website.
Bundle

2018 KS2 Test and Writing Analysis Bundle
Test analysis for 2018 KS2 Mathematics, Grammar and Reading Tests . Plus the 2018 Writing analysis tool.

2018 KS2 National Curriculum (SATs) Test Analysis for Mathematics
2018 KS2 National Curriculum (SATs) Test Analysis for Mathematics.
Please see release notes for new features.
Analysis for all tests is available elsewhere on TES or form our website.

2018 KS1 National Curriculum (SATs) Test Analysis for Grammar, Punctuation and Spelling.
2018 KS1 National Curriculum (SATs) Test Analysis for Grammar, Punctuation and Spelling.
Please see release notes for new features.
Analysis for all tests is available elsewhere on TES or from our website.
2018 KS1 National Curriculum (SATs) Test Analysis for Mathematics
2018 KS1 National Curriculum (SATs) Test Analysis for Mathematics.
Please see release notes for new features.
Analysis for all tests is available elsewhere on TES or from our website.

2018 KS2 Writing Electronic Analysis Tool With new enhanced pupil reporting
This is a new tool intended to help leaders, teachers, children and parents organise, inform and
plan for future learning. Due to the complexity of the current assessment system (and if you are
used to using the PrimaryTools Tests Analysis Tools), there are a few things to be aware of using
this tool.
Firstly, if you are confident a pupil has already met the Working Towards criteria (W/T),
we recommend filling in the '1s' on the data input tab for Working Towards rather than leave them
blank (not assessed), and likewise for those working at a Greater Depth (G/D). Most children will
be working within and towards the Expected standard, and this tool focuses on them. Many of the
tables and charts will only be based on the Expected Criteria (the headings will make this clear).
We cannot stress enough that this should be used in conjunction with the Frameworks. The
criteria have been derived from them as closely as possible, but do not match exactly with them.
Criteria starting with 'e.g.' are examples and not necessarily required to meet the expected
standard, however this tool will treat those criteria as required. Use this as a tool to inform and
read the frameworks!
We hope you will like the enhanced Pupil Reports. There is a second page with a thorough
break down of what a pupil needs to focus on. Send us an email if there is something you
are not sure of, we would very much love your feedback too! info@primarytools.co.uk.

Rapid Grammar for Lower Key Stage 2 - 49 quick activities based on the National Curriculum
49 Quick Grammar, Punctuation and Vocabulary activities for Lower Key Stage 2
Quick activities designed to last up to 10 minutes. Based on the requirements of the National Curriculum.
Includes all new categorised questions, with answers included.
Great for homework, independent learning or whole class teaching.

Rapid Reading - 50 Quick Reading Activities for Key Stage 1
Quick comprehensions designed to last up to 10 minutes.
• Based on texts from previous curriculum tests
• Includes new and original questions.
• Great for homework, whole class or independent learning
• 3 different levels of text
• Categorised questions
• Answers included.
Bundle

2018 KS1 Test and Writing Analysis Bundle
Test analysis for 2018 KS1 Mathematics, Grammar and Reading Tests . Plus the 2018 Writing analysis tool.